
Planet Hunters NGTS update
Hello Planet Hunters community!
I wanted to take the time to say thank you to this amazing community that has been an essential part of my work life for the past 4+ years. I won’t be working on Planet Hunters NGTS in future as I’m changing jobs and won’t be working in astronomy anymore, so before I go and handover the management of the project, I wanted to give an overview of what we’ve achieved, what the past 4 years have been like for me, and bid you all farewell.
We launched Planet Hunters NGTS at the start of my PhD back in 2021 and, as of February 9th 2026, we have received 7,288,804 classifications from 20,883 registered volunteers across 379,470 different light curves between the 3 different workflows. This led to two publications, the first of which announced the discovery of 5 new planet candidates while the second delved deeper into one of these systems to find that it was in fact a binary star system that will provide a useful benchmark for astronomers to test models of how stars evolve. Personally, these discoveries formed the basis for my PhD thesis which I submitted last April and “defended” during my viva in July. The viva was a ~3-hour verbal exam where two experts asked me all about what I’d been doing for the last 4 years and how this contributes to our knowledge of astronomy. I’m pleased to say that they agreed that the discoveries this community helped to make were important contributions to astronomy and I was awarded my PhD! This has been a long, arduous journey for me but one of my regular sources of motivation was always the incredible enthusiasm I was met with whenever I interacted with you, the volunteers.
In the past year I’ve been working primarily on developing software for the upcoming Legacy Survey of Space and Time (LSST) (unrelated to what I’ve been working on but check out the Rubin Observatory Zooniverse projects!). I’ve tried to keep data flowing on Planet Hunters NGTS in the hope that we might find more interesting astrophysical phenomena hidden in the NGTS data but unfortunately I haven’t had time to search through the final candidate lists myself. With my current position ending, I am passing the analysis I have been able to complete into the extremely capable hands of my PhD supervisor, Dr Meg Schwamb, who will be exploring new directions for the project.
The following paragraph is from my PhD thesis acknowledgements: “I am thankful to all the citizen scientists who partook in Planet Hunters NGTS. A PhD cannot be done alone, and that is especially true when the work of over 18,000 volunteers provides such a crucial component of this work. I will be forever thankful for the incredible enthusiasm from all those who submitted classifications, discussed candidates on the talk forums and were so excited by the results we were able to achieve together. I hope that I will continue to have the opportunity to work with this passionate and engaged community in the future.” I cannot fully express how thankful I will always be to this community and while currently my career path will see me leave the field of astronomy, I do truly mean the final sentence and I hope this isn’t goodbye but simply, see you later.
Happy classifying,
Sean
NGTS-EB-8: An eclipsing binary discovered by you! (Part 2)
In Part 1, I described the new observations we acquired for one of our candidates to try to determine whether it was an exoplanet, or, in fact, a binary star system. The crucial radial velocity measurements revealed the latter was true and in this post I will describe what we have since learned about the system as we analyzed it further.
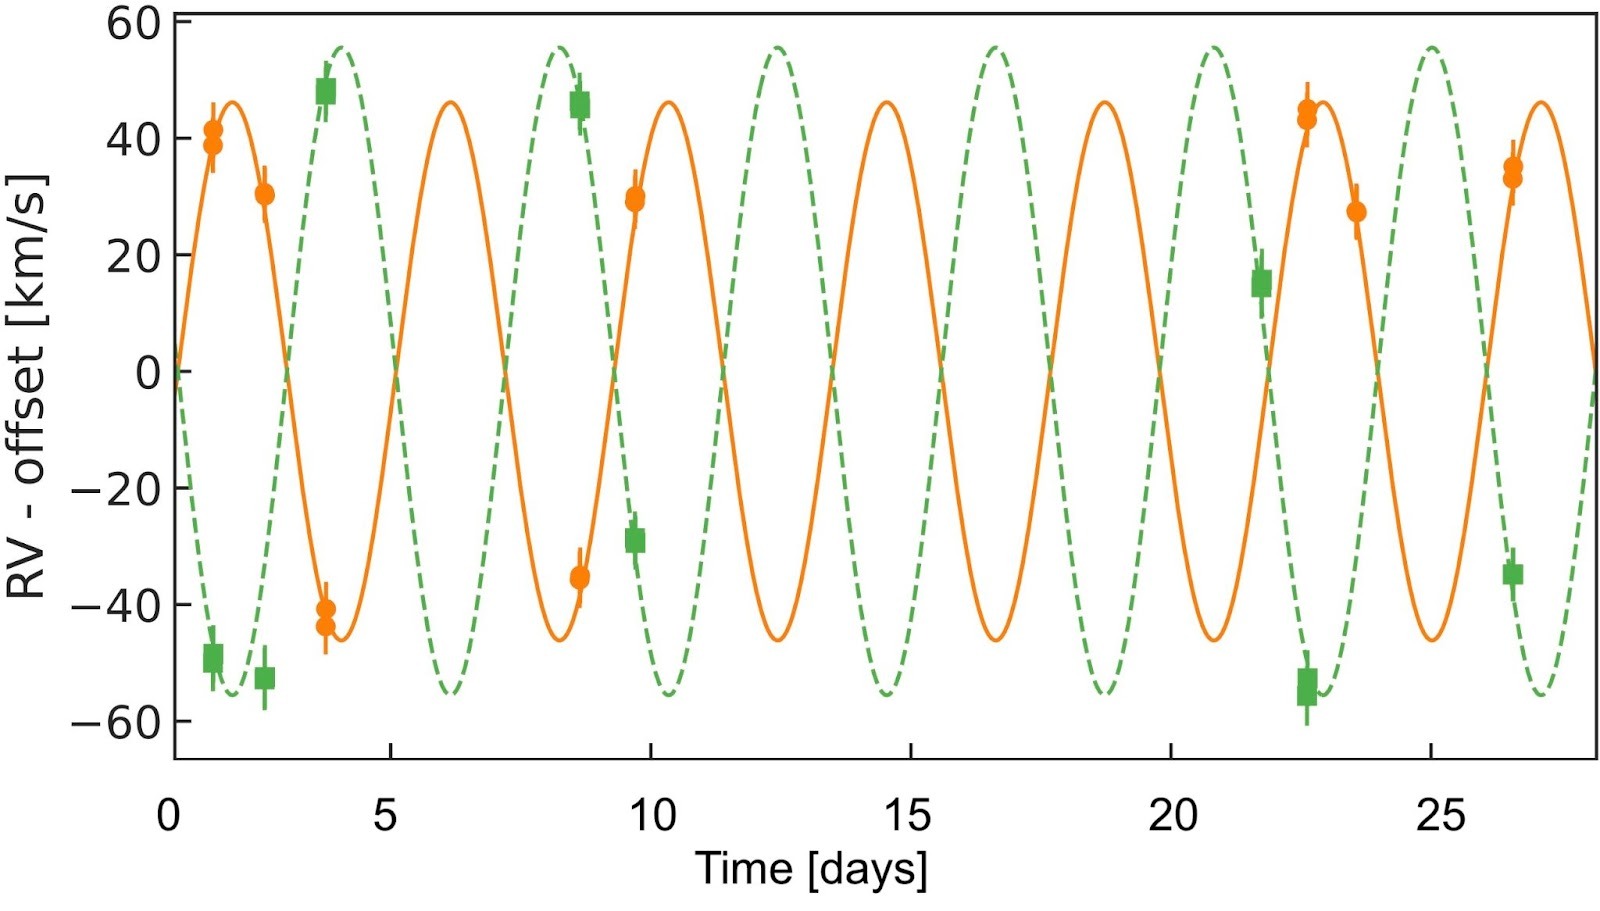
We took another look at the NIRPS observations with the knowledge that we were actually looking for two stars, and we were able to measure the radial velocities (RVs) across the whole month of observations for both stars. The image below shows these RVs in two different colors with the orange circles showing the velocity measurements for the larger of the two stars (the primary star) and the green squares showing the measurements for the smaller star (the secondary star). The lines show the best fit models to the data and these nice clear RV curves allow us to get a really good idea of the ratio of the masses of the two stars. The ratio of the masses is equal to 0.83, meaning the two stars are quite similar in mass (if they were equal they would have a mass ratio of 1, while a value closer to 0 would suggest they have very different masses).
We were also able to determine that the orbital period (how often the stars go round each other) was actually double what we thought, meaning that they were orbiting one another every 4.2 days. This was an important discovery as this told us that what we had believed to be one object causing a transit every 2.1 days was actually two different eclipses! This is exactly the kind of thing the Odd/Even Transit Check is meant to spot, so why didn’t we? The plot on the left below shows the image that was classified in Planet Hunters NGTS and unfortunately the bottom of the transit was cut-off! This was because the algorithm that initially detects the transit signals underestimated the depth so then when the diagnostic plot was created it didn’t show the full extent of the transit. The plot on the right shows the odd/even for the full depth of the transit, which we were able to use to take a closer look at the data, and even here the difference between the depths of the green and magenta points is so subtle that it wasn’t enough to conclusively determine that this was in fact an eclipsing binary.


Equipped with our new knowledge of the correct orbital period, we were then able to model all the available data and derive measurements of the individual masses and radii of the two stars in the system. These are crucial measurements, as the mass and radius of a star allow us to compare it with other similar systems that have been discovered in the past and draw conclusions about whether the system follows theoretical predictions or deviates from what we expect! The image below shows different stars discovered in eclipsing binaries as black points and the theoretical mass-radius relation as a blue line (this is what theoretical modelling suggests should be the mass and radii of stars). The values on the axes are expressed in terms of solar units, meaning that our stars are approximately one quarter the radius of the Sun (~0.25 R⊙). The orange point shows the position of the primary star while the green point shows the position of the secondary star.

This plot shows us that both stars align well with the theoretical prediction (the blue line). That may sound obvious, but low-mass stars are a particularly interesting case where there is currently a “radius inflation problem” seen. The radii of low-mass stars that we discover in general appear larger than the theoretical models suggest (you can see how a lot of the black points sit slightly above the blue line in the plot), and so there is currently some confusion over the mechanisms that might be causing this. Therefore by discovering more systems that are aligned with the theoretical models, we can place better constraints on how significant this problem is, whether the models need to be altered, or if better observations could reveal more about the true masses and radii of all these stars. Eclipsing binary systems like this are generally really useful tools for calibrating other methods of estimating stellar masses and radii. As you can see, it takes a lot of observations and a lot of analysis to measure the masses and radii of just two stars. Therefore it’d be extremely impractical to have to do this for every single star we normally observe in a survey like NGTS or TESS and so we need different ways to determine the properties of most stars. By getting these accurate measurements that are independent of the typical methods used to determine stellar properties, we can calibrate the methods used to get even more accurate estimates of the masses and radii of a much wider range of stars!
While this system isn’t a planet orbiting a star as we had initially thought, it’s still a really interesting and valuable system that will hopefully be useful to astronomers in the future. This discovery wouldn’t have been possible without the Planet Hunters NGTS project and to recognise the important role that citizen scientists played in this discovery, the names of all those who classified this system in Planet Hunters NGTS (and gave consent for their name to be used) are included in the author list of the journal article! The official journal article will be available at the following link in a few weeks: https://doi.org/10.3847/1538-3881/ae0e0d, but you can already read the pre-print version on arXiv here: “NGTS-EB-8: A Double-lined Eclipsing M+M Binary Discovered by Citizen Scientists”.
NGTS-EB-8: An eclipsing binary discovered by you! (Part 1)
In my previous post describing the planet candidates that you helped discover as part of the Planet Hunters NGTS project, I mentioned the candidate TIC-165227846, an exciting system that at the time we believed to be a giant planet orbiting a small star. These kinds of systems are really interesting because they’re so puzzling. Planets form from material that orbits a new star in a disk-like structure called a protoplanetary disk. The amount of material in the disk correlates with the mass of the host star, so a really small star will have less material available for planet-building and therefore giant planets just shouldn’t be able to form! Given how interesting and rare this target was (at the time we found our candidate, there were only ~10 planets like this, and even now scientists have only found ~30 planets of similar size orbiting close to really small stars), we decided to get more observations to try and determine what kind of star-planet combination we were really seeing.
We’d already acquired speckle imaging observations (you can read more about what those are here) which told us that there probably wasn’t a nearby star that would give us a false impression of the transit depth. The next step was to get radial velocity observations. This technique works by detecting how much a star is “wobbling.” When we say the planets orbit the Sun, really we mean the planets AND the Sun orbit the entire Solar System’s common centre of mass, it just happens to be that this point is very close to the Sun since it’s so big. It’s the same story for exoplanets and stars orbiting one another, they all move around the system’s centre of mass. The wobbling that we detect from the host star is caused by any exoplanets or other stars that are orbiting it, and the amount of wobble relates to how much mass the object orbiting the host has. What this means is that if the star isn’t wobbling much, then it’s likely that the thing causing it to wobble is a planet, but if we see really large changes in the velocity of the star, or are even able to measure two different stellar signals, then we can determine that we are in fact seeing a binary star system, i.e. two stars orbiting one another!
We can measure how much the star is moving using spectrographs, which are instruments that split the light from stars into its individual wavelengths, similar to how a prism splits light into a rainbow. This allows us to see specific lines in the spectrum of the star that move depending on the relative velocity of the star due to the Doppler effect (the Doppler effect is the same effect that changes the pitch of an ambulance siren as it moves towards and away from you, it’s all about wavelengths changing with velocity).
We first used the Near Infra Red Planet Searcher (NIRPS) instrument that is mounted on the 3.6-metre telescope at the La Silla Observatory in Chile. We took 9 different measurements of the system over the course of a month however because the system is so faint, we couldn’t definitively tell if we had detected a planet or another star orbiting really close to the host. We next obtained observations with the Gemini High-resolution Optical SpecTrograph, or GHOST (astronomers love their terrible forced acronyms), which is mounted on the 8.1-metre Gemini-South telescope in Cerro Pachon, Chile. The bigger telescope means that we could collect more light from the star and therefore overcome the issue of it being so faint. This allowed us to get good enough observations to get a more definitive answer. The image below shows the key information for diagnosing whether this system is made up of a star and planet or two stars. It’s called a cross-correlation function and this is the tool we use to measure those velocity shifts, with any large dips being caused by a star moving with the velocity that the dip matches up with on the x-axis.

And there it is! Two big dips in the intensity indicating that we in fact are looking at two stars orbiting one another! In Part 2 I’ll talk more about what we learned about this system and why we didn’t spot it sooner!
