
Comets or Aliens?
Let’s deal with the big question first. Has Planet Hunters discovered aliens?
The answer is no. But that doesn’t mean that all of the press who have written about us in the last 48 hours, sending a flood of volunteers to the site, are completely misguided. Let me backtrack…
A few weeks ago we submitted the ninth planet hunters paper to the journal, and that paper is now available on the arXiv service. Led by Tabetha Boyajian at Yale, it describes a rather unusual system (what the Atlantic called the most interesting star in the Galaxy), which was identified by Planet Hunters, four of whom (Daryll, Kian, Abe, Sam) are named on the paper*. They spotted a series of transits – which is normally what signifies the presence of a planet – but these were unusual.
The star’s light dimmed for a long period of time, loosing a fifth of its brightness for days or even months at a time. More mysteriously, the duration of the dips was not always the same, so this couldn’t possibly be a planet. This behaviour is unique amongst the more than a hundred thousand stars studied by Kepler – we have a bone fide mystery on our hands.I think the team’s immediate thoughts were that it must be the star itself that’s misbehaving, but stars aren’t known to behave like this and some careful follow up reveals it to be nothing more than a normal F-type star, slightly hotter and more massive than the Sun. So it’s not the star, and we’re sure too that it’s not Kepler itself misbehaving; something is really blocking the light from this star.One option is a disk of dust around the star. It’s from such disks that planets form (see DiskDetectives.org for more on this!) and so that wouldn’t be too surprising. Yet enough dust to cause the deep eclipses we see would glow brightly in the infrared, and there’s no sign of a strong infrared source around this star.
You can read the paper to find out what else we considered, but we think the best explanation is that there is a group of exocomets in orbit around the star. Comets are an appealing scenario to invoke because they would be faint in the infrared, and because they move on elliptical orbits, accounting for the random timing of the transits and their different lengths. Such a group of comets could have come from the breakup of a larger object, leaving a cloud of smaller remnants in similar orbits behind.
Much detailed work is needed to flesh out the details of this (pleasingly outlandish!) scenario. One possibility is that the recent passage of a nearby star triggered the cometary bombardment whose effects we’re seeing. The paper is currently in the peer review process and there is – of course – the possibility that there is a perfectly sensible solution we haven’t yet considered. However, so far over 100 professional scientists have had a look at the lightcurves and not managed to come up with a working solution.
One other proposed theory is that this pattern of behaviour is due to a fleet of alien spaceships in orbit around a star, a possibility considered by Jason Wright and collaborators here. Jason and co were tipped off about our discovery by the team, and it’s included in their paper as an object with ‘a bizarre light curve consistent with a “swarm” of megastructures’, much to the excitement of much of the internet. ‘Consistent with’ isn’t the same as ‘definitely is’, of course – and personally, my money is very firmly on the comet theory with a side bet on weird stellar behaviour – but until those models are properly investigated alien spaceships remain a possibility. The Wright paper points out this star is now a supremely interesting target for SETI (the search for extraterrestrial intelligence), and we agree – I hope radio astronomers will go and listen for signals. We need more observations of transits in action, too, and will be trying to follow-up to try and work out what’s actually going on.In the meantime, who knows what else is lurking in the Kepler data? Planet Hunters is about finding planets, but this ability to identify the weird and unusual is one of the project’s great advantages. Get clicking at www.planethunters.org, and let us know through Talk if you find anything a little odd.
Chris
* – This isn’t the final version of the paper, and we have more names to mention too before we’re done.
Extracted Lightcurves From Vanderburg & Johnson (2014) Now Available at MAST
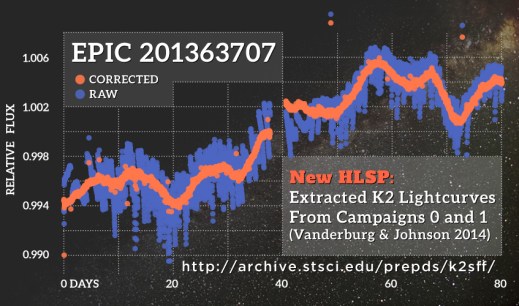
A new MAST High Level Science Product from K2 has been delivered that includes extracted lightcurves. Courtesy of Vanderburg & Johnson (2014), long-cadence targets from Campaigns 0 and 1 now have detrended, extracted lightcurves available at MAST, including 20 different photometric apertures. There’s a MAST Classic Search Interface so you can get lightcurves based on target IDs, coordinates, EPIC catalog fluxes, etc. You can also use our interactive plotter to explore the lightcurves using any of the photometric apertures before downloading the FITS files. Check out all the details here: http://archive.stsci.edu/prepds/k2sff/
This is Not a Simulation
When someone tries to explain the concept of planet transits, you often see simulated graphics like the one below:
Well James Gilbert from the University of Oxford took the video of the transit of Venus he captured in 2012 (which was a real example of the transit technique in our backyard) and made the simulation into a reality. He measured the Sun’s brightness throughout the duration of the transit video, and the result is the below:
That’s no simulation! It’s truly amazing. You can find out more about how James made the video and took the footage at his blog: LabJG: James Gilbert.
Planet Hunters at Girls Do Hack
Today we have a guest post by Lauren Kelly. Lauren is an Educator for STEM Student Experiences at the Adler Planetarium in Chicago, IL, and holds a degree in Science Journalism from Columbia College Chicago. She loves working with young people and encouraging them to explore science.
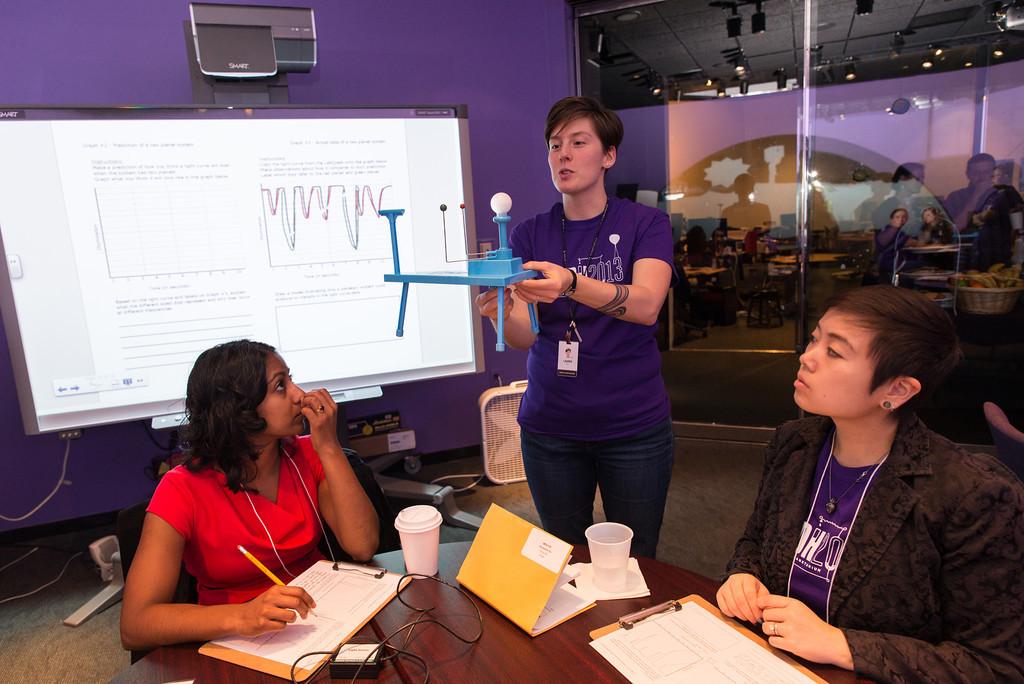
Image credit- Adler Planetarium
On November 9th, 65 young women participated in Girls Do Hack at the Adler Planetarium, where they explored science, technology, engineering and math skills and fields as future career options. It was a incredibly fun, inspiring day.
As an Adler educator, I had the wonderful opportunity of leading a session about detecting exoplanets that many of the girls participated in. During the session, participants discovered how scientists find exoplanets using the transit method by doing a hands-on experiment creating and measuring light curves, practicing categorizing transits on Planet Hunters and working with the help of a postdoc Astronomer to explore real systems using NASA’s Eyes on Exoplanets program.

Image credit- Adler Planetarium

Image Credit: Adler Planetarium
Starspots and Transits
There was a great question about transits in response to my post about “What Factors Impact Transit Shape” so I thought I’d answer in a blog post.
Jean Tate asked:
Question: In the image of Venus transiting the Sun, there are sunspots. How common are sunspots on the Sun-like stars in the Kepler field? How do sunspots change the transit light curve? How are sunspots modeled?
Starspots are dark blotches on the surface of the star and are regions of intense magnetic activity. Their temperature are lower than the rest of the photosphere which gives them their dark appearance. These blemishes are transitory and last anywhere from hours to months. They are an indication of the magnetic activity of the star, and the Sun goes through an 11-year cycle where the number of starspots (or sunspots as we call them on the Sun) changes. The more active the Sun, the more sunspots visible on its surface.
If you viewed the transit of Venus last July, there were several sunspots on the surface of the Sun which you can see in the image below.
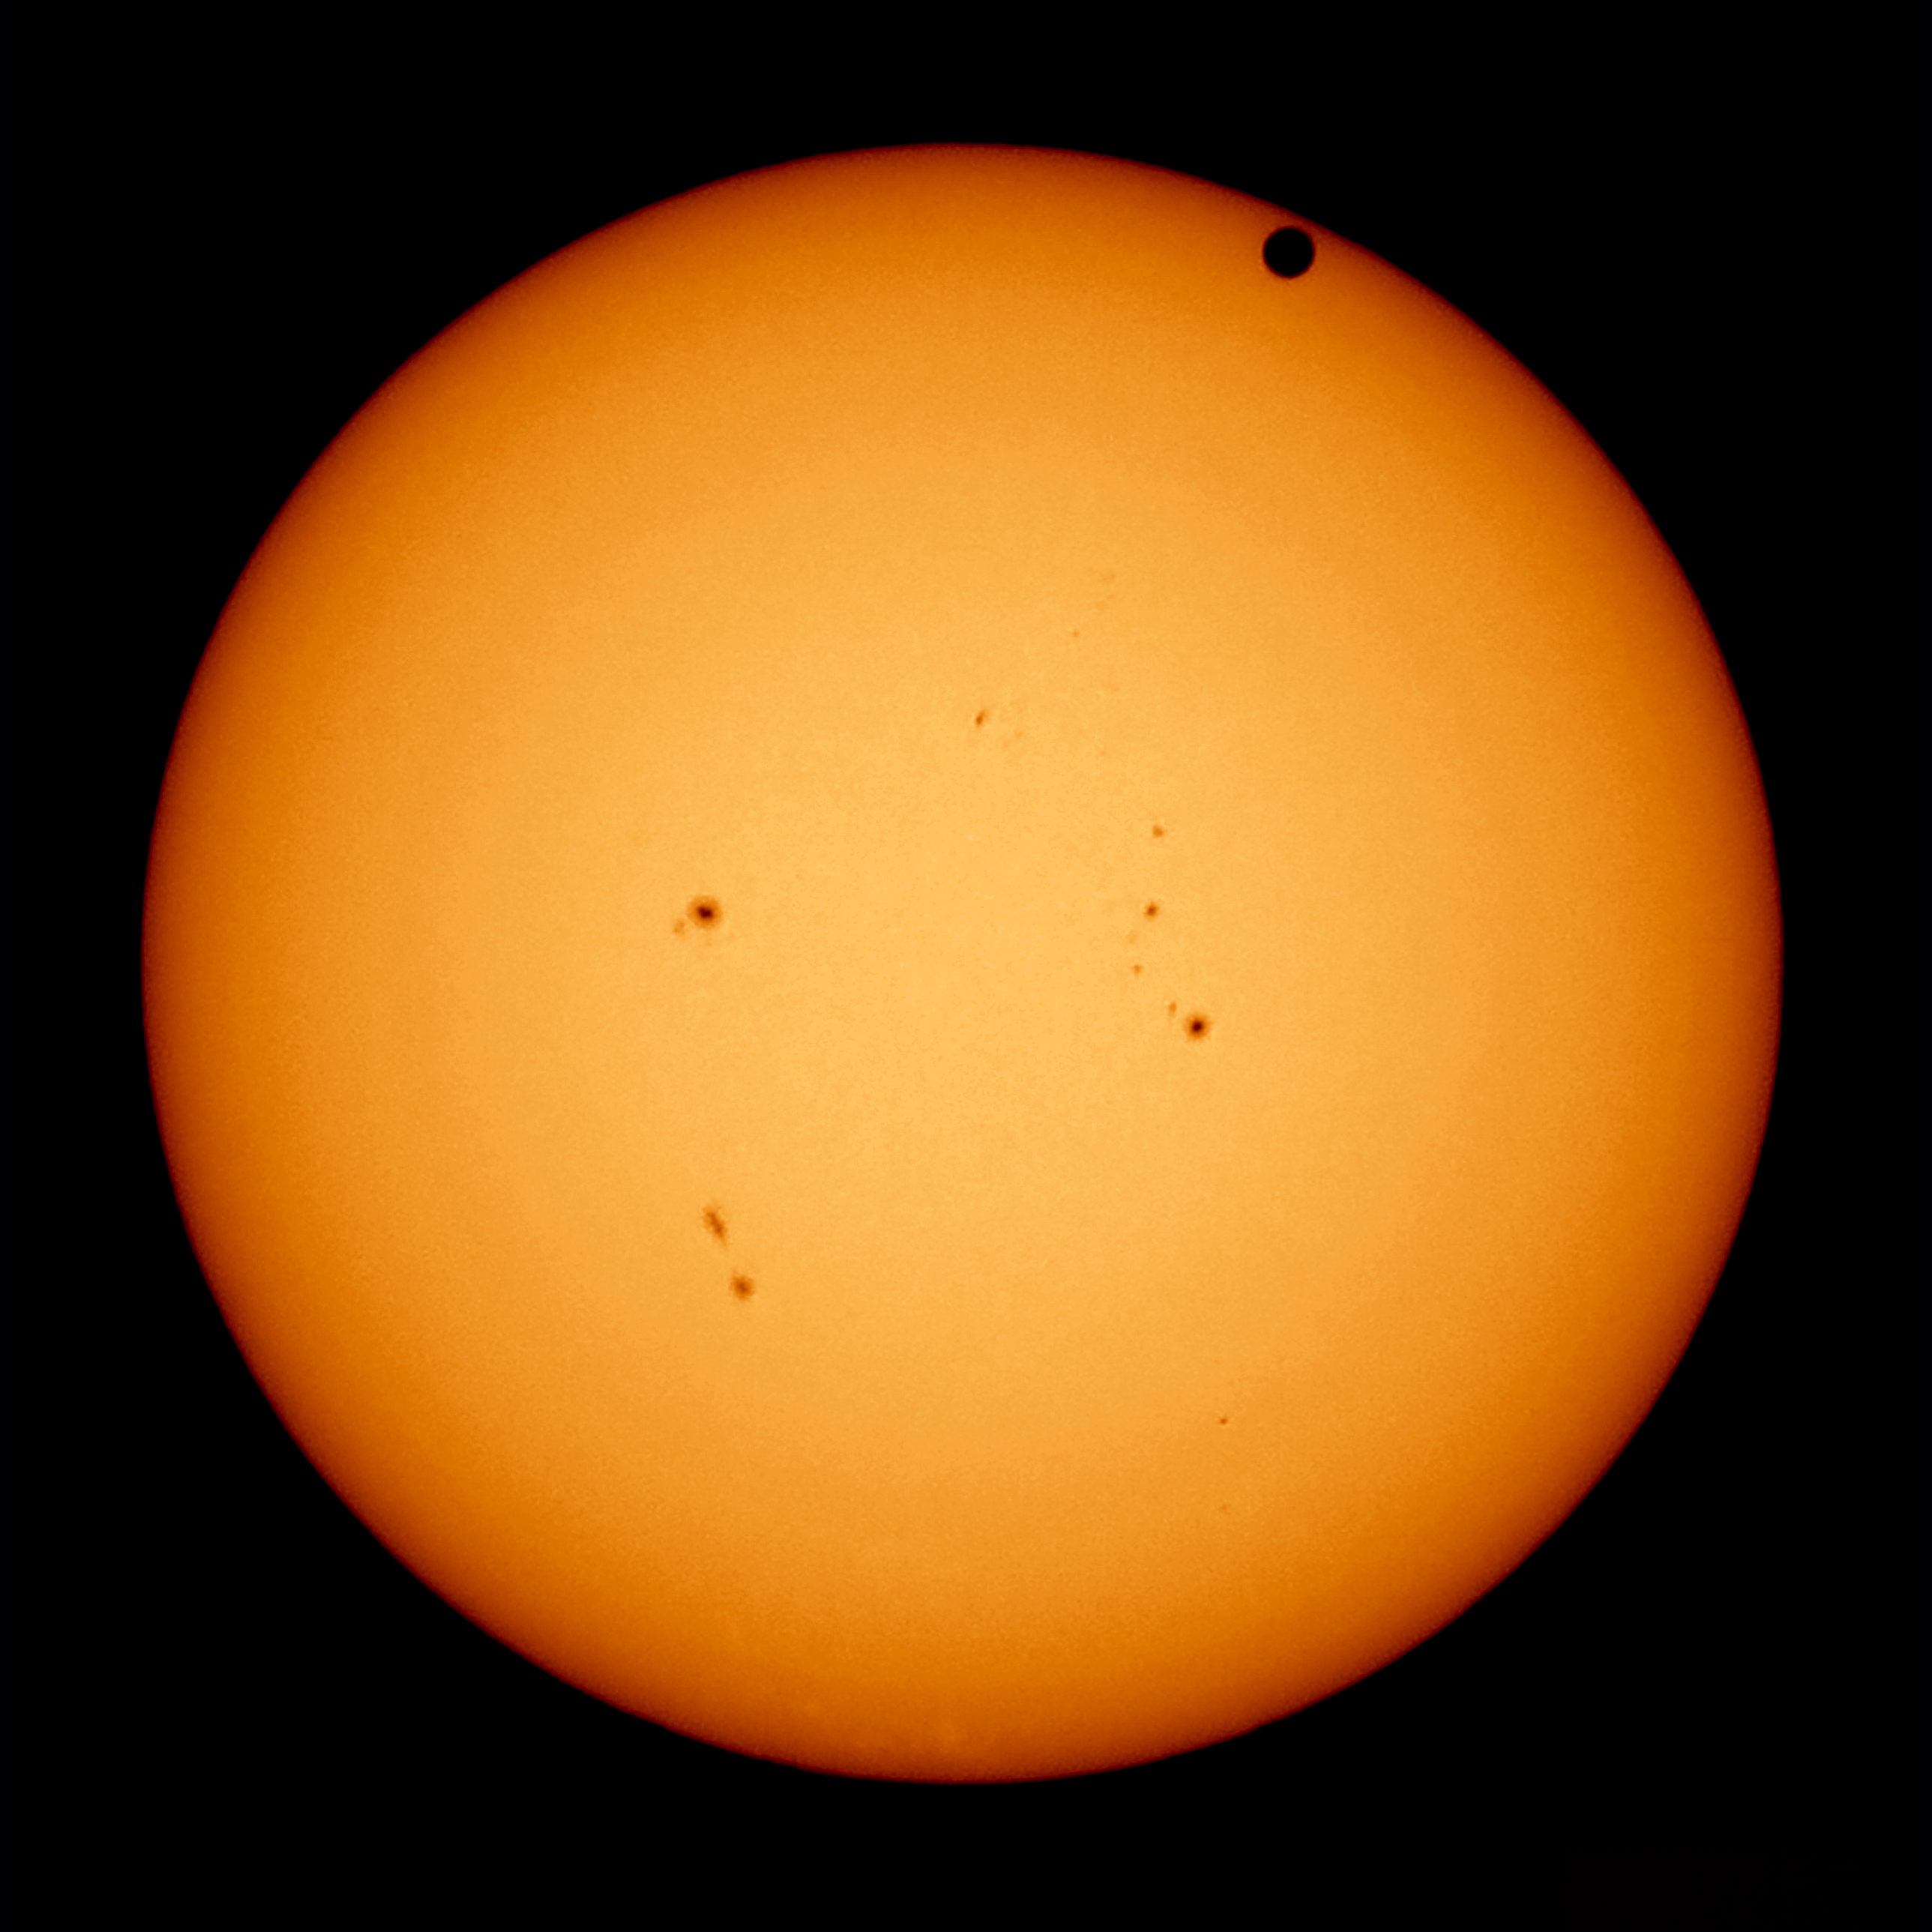
Transit of Venus – Image credit- Wikipedia – http://en.wikipedia.org/wiki/File:2012_Transit_of_Venus_from_SF.jpg – Venus is at the top right of the Sun’s disk. Other dark blotches are sunspots.
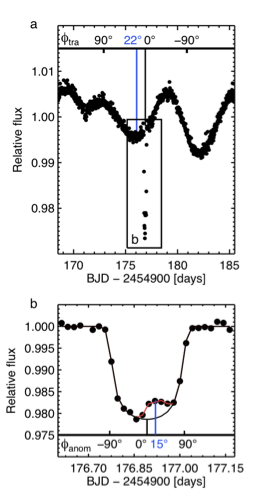
On the Sun we can actually spatially resolve the sunspots, but on other stars we can’t. So for Kepler that is monitoring stars thousands of light years away, we detect starspots through the light curve. As the star rotates, starspots will come in and out view causing changes in the star’s brightness. The pattern in the star’s light curve will repeat once per rotation period of the star. At the equator, the Sun rotates every 24.47 days much longer than the short few-tens of hours that a planet transit lasts.

Light curve likely showing star spot variation
If the transiting planet doesn’t cross over a starspot we get a fairly rounded U-shaped symmetric bottom to the transit as you can see below for a set of simulated planet transits.

Simulated planet transits including limb darkening of the star. For the plot I assume the star 0.8 times the radius of the Sun and the planets cross the center of the star
Because planet transits last a few to tens of hours and stars rotate over a period of days, you can think of the starspot as effectively stationary with the planet moving across it during the transit. The starspot is not as bright as the surrounding areas of the photosphere, so when the planet transits across that starspot the lightcurve gets a bit brighter than average and you don’t see a symmetric bottom to your transit. So you see a small positive bump in the transit lightcurve. In the observed transit shown below, the planet crosses a starspot during the second half of the transit.
Planet transit of Kepler-30c across a star spot Figure from Sanchis-Ojeda et al 2012. (http://arxiv.org/abs/1207.5804)
Planets transiting starspots can be extremely useful. Those transits have been recently used to measure the alignment of the planet’s orbit to the rotation axis of the star. In our Solar System, the planets are about 8 degrees off from being aligned with the Sun’s rotation axis, but other planetary systems are severely misaligned.
If the planetary system is aligned with the star’s rotation axis, then the planet transit path is a chord that always crosses over the starspot when it is in view, so you will see many of the planet transits having the signature of a starspot crossing. Because the star is also rotating between transits, the starspot will be likely be in a different place on the star’s disk the next time the planet comes around so you will see the timing of the bump change from transit to transit. If the orbit is misaligned, then only when the starspot is in a position crossing the planet’s transit chord across the star’s surface will there be a positive bump in the transit lightcurve. So the next several transits the planet has extremely low chances of being timed such that the starspot is in the same position on the star’s disk for the event to repeat. So you should see no starspot signal in subsequent transits. You can see this effect below in the figure from Sanchis-Ojeda et al 2012.
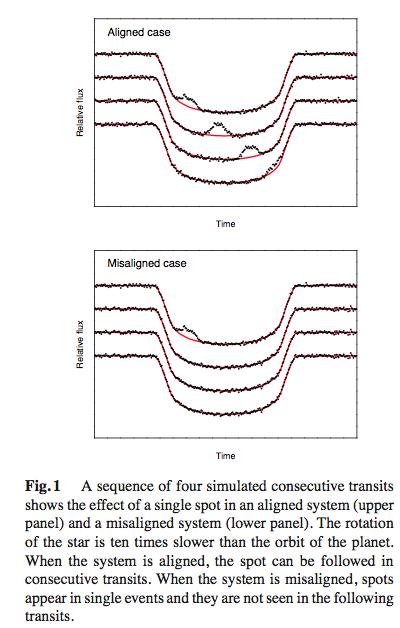
Figure from Sanchis-Ojeda et al 2012 (http://arxiv.org/abs/1211.2002)
What factors impact transit shape
I’m rewriting the simulation code I use for making simulated transits and injecting them into Kepler light curves from a program language called IDL to python. I’m working on a new paper idea and project with Planet Hunters so I thought now would be the perfect to time to make the coding switch. The actual part of the code that computers the shape of the transit comes from publicly available code written by another astronomer, Ian Crossfield (if you want to play with the code you can find it here).
I’ve been doing some simple tests to make sure the code works and thought that it would be worth using the test output as a great way to talk about a few things that affect the transits that you see in the Kepler light curves on the Planet Hunters website.
Ratio of the size of the planet to the size of the star:
The transit depth is the ratio of the surface area of the star’s disk blocked out by the planet’s disk. So the transit depth is the square of the planet radius divided by the star’s radius. The majority of Kepler stars are similar in size to the Sun or a bit bigger or smaller, so in general the bigger the planet the bigger the transit you see.
Below is the ideal transits you’d see for a series of planet radii assuming the star was perfectly quiet and is uniformly bright. For the plot below I assume the star 0.8 times the radius of the Sun and the planets cross the center of the star. 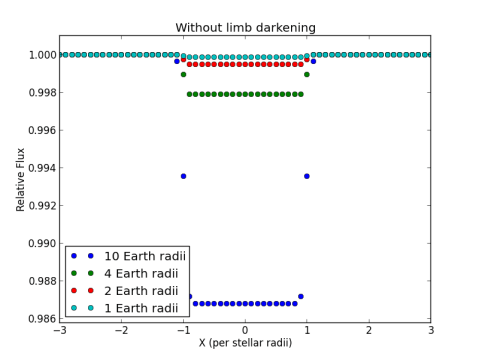 These transits are very boxy – In real life they won’t look like this at least not on the ingress and egress (the edges of the transit). That’s because the a star is not a uniformly illuminated disk. It is darker at the edges than it is at the center. We call this limb darkening. What is happening is that you are seeing into different layers of the Sun depending on how far from the center of the disk. So the center is hotter layers and therefore brighter than the edges. You can see the effect when looking at the Sun shown below during the transit of Venus.

Transit of Venus – Image credit- Wikipedia – http://en.wikipedia.org/wiki/File:2012_Transit_of_Venus_from_SF.jpg – You can see the limb darkening is quite apparent. The edges of the sun are darker than the center.
Limb darkening changes mostly the edges of the transit making them softer and rounder less box like. If we account for limb darkening for the same planet transits shown in the previous plot, they now look look this:
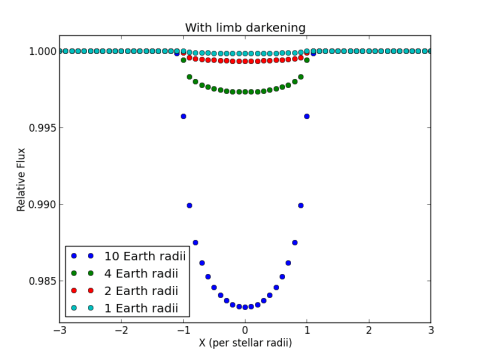
Simulated planet transits including limb darkening of the star. For the plot I assume the star 0.8 times the radius of the Sun and the planets cross the center of the star
You can see the transits are more U-shaped like we see in the Planet Hunters interface. Now the plot is very zoomed in, it shows 3x the star’s radius on either side, but if you zoomed in on Planet Hunters this is what you’ll see for a spotted transit if the planet is very large and the transit depth is pretty large compared to the measurement noise of Kepler.
Another factor to account for is the impact parameter. You can think of the planet’s transit across the star in the x- direction and think of the impact parameter as the y project coordinate of the transit. In essence you can think of as the impact parameter (b) as how close in the y direction is planet to the center of the star’s disk.
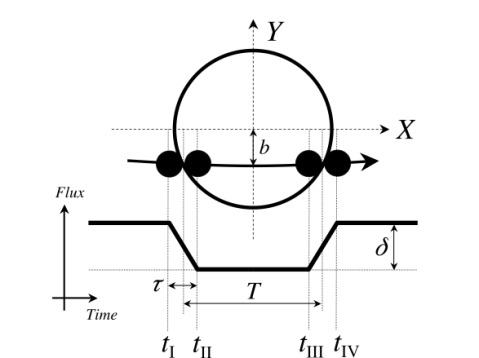
Transit schematic from Winn 2011 – http://arxiv.org/abs/1001.2010v3
Changing the impact parameter changes the duration of the transit. If we assume no limb darkening and a uniformly illuminated stellar disk this is what you would see:

Larger b higher from the center of the star the planet crosses. Transits of a 10 Earth radii (Jupiter-sized planet) with varying impact parameters and no limb darkening assuming a 0.8 x Solar radius star
Now if we add in limb darkening we get:

Larger b higher from the center of the star the planet crosses. Transits of a 10 Earth radii (Jupiter-sized planet) with varying impact parameters with limb darkening assuming a 0.8 x Solar radius star
You can see for the highest impact parameter (where the planet is crossing very close to the edge of the star) the transit looks pretty V-shaped like an eclipsing binary eclipse when we account for limb darkening. This is why if you see a V-shaped transit we typically think it’s most likely not a planet transit because the vast majority of times the planet transits will be U-shaped with a flatish bottom. You also see the depths on the bottom change slightly. This is because they are not all crossing the very center of the star which is the brightest point anymore.
One other factor that will effect the shape will be the duration of the transit which depends on the orbital period of the planet and the eccentricity of the orbit, but for all of these plots I’m plotting in the X-axis in terms of the size of the star.
The Road to Characterizing PH1: The Overview

Haven Giguere/Yale
It’s been an exciting week for exoplanets with the discovery of PH1 and the discovery of an Earth-mass planet around the closest star to Earth (Alpa Centauri B). In the coming days and weeks, you’ll hear more about the specifics of how we came out confirming and validating the discovery of PH1 and solidifying that it was a planet orbiting the two central stars in a four star system, but I wanted to give a brief summary of the data and results.
This effort has taken months and months from obtaining the telescope observations, to modeling the light curves, combining Kepler data with radial velocity observations, and applying stellar evolution models. Robert Gagliano and Kian Jek get enormous credit for the discovery and starting this process off and recognizing and spotting the planet transits.
Many collaborators have worked hard to confirm PH1 and study its properties, especially: Jerry Orosz, Josh Carter, Willie Torres, and Debra Fischer who have put tremendous effort (particularly in the past few weeks) to get us from so we found some transits to bona fide planet.
Everyone in this collaboration involved in the paper (including Kian and Robert who were coauthors on the discovery paper) are listed below:

To summarize PH1’s confirmation story, I thought I’d share my press talk slides:

Robert and Kian identified three transits in the light curve of an eclipsing binary . In the binary, there are two stars, one larger and hotter and one smaller and cooler. When the smaller cooler star crosses the face of the larger hotter star, you get some of the larger star’s blocked out and we call that a primary eclipse. When the smaller cooler star crosses behind the larger hotter star, we get a secondary eclipse where the light from the smaller cooler star is blocked out. So we see this big dip+ small dip pattern. Robert and Kian noticed three transits separated by ~137 days in Quarters 1-5 data superimposed on the light curve indicating a third small body in the system, and notified the science team of a possible circumbinary planet.

There’s a small chance that we’re seeing a false positive, where on the sky our Kepler eclipsing binary is aligned with a faint background eclipsing binary giving rise to the transit-like signal. If the transiting body is truly orbiting both stars, we have a way of checking. A body in a circumbinary orbit (orbiting around both stars in a stellar binary), is orbiting a moving target, so the positions and velocities of the two stars are different each transit. So this means that at each transit, there are slightly different gravitational tugs on the planet causing the timing and the duration of the transit to change. We see these changes and this gives us high confidence the planet is really orbiting the Kepler eclipsing binary and not some background source. If you look below at the 7 planet transits across the larger bigger star in the binary, you can convince yourself that the widths of the transits are changing. So bingo, planet!

We got radial velocity observations from the Keck telescopes on Mauna Kea. The radial velocity observations measure the wobble of the larger star in the binary that the planet orbits. With the precision of the observations and time duration we have on the observations, we cannot measure the wobble caused by the gravitational pull of the planet. What we are measuring is the wobble due to the gravitational tug of the smaller star as it orbits the larger star in the binary.
To our surprise we found two velocity contributions in the radial velocity observations. One is from the larger star in the eclipsing binary (solid points) with the model fit for the velocity observations shown in red. The 2nd component is stationary over the roughly 5 months we were taking radial velocity observations. This 2nd component is coming from a source that is providing some light in the spectra slit we place across the Kepler target when observing on Keck. It has the same value as the average or systemic velocity of the binary. So if you take the average value of the black points that’s the velocity of the eclipsing binary (and planet host stars) moving towards or away form us. This second component has the same velocity and random field stars have velocities in the galaxy ranging from ~20-60 km/s so to have a source that has to be very close to the eclipsing binary on the sky that we see it in the Keck observations and have the same average velocity as the eclipsing binary tells us that this source is bound to the eclipsing binary.

We used adaptive optics observations from the Keck II telescope to zoom in and look around our eclipsing binary for other stars that would be contamination the Kepler photometric aperture. We also used deep optical imaging to look for slightly further contamination stars as Bill Keel described in his blog post. As Bill discussed in his post, if there are stars providing extra light to the aperture that is summed up to make the Kepler light curve, it will give us the wrong planet radius. This is because the extra light will decrease the observed transit dips causing us to underestimate the size of the planet. We go these adaptive optics observations while we getting the radial velocity observations.
In the adaptive optics observations there is a source 0.7” away (or about 1000 AU) from the eclipsing binary, and we knew about its existence when we were analyzing the Keck radial velocity observations. There is was the ah-ha moment, where we went oh, this source in the adaptive optics observations must be that second velocity source we see in the radial velocity observations, that we think is gravitationally bound to the eclipsing binary orbiting well outside the planet’s orbit. To our surprise the adaptive optics observations revealed that this source is elongated in one direction (which you can see in the slide below). What we think this means is that we’re just barely resolving the source as a visual binary (2 stars!). So that we have a pair of stars, getting 2 for the price of 1 – (getting us to four stars in the system!) orbiting the eclipsing binary. Our best guess from the Keck observations is that the 2 stars in the distant binary are separated by no more than 40-50 AU.

Combining all of these observations, we went after obtaining the properties of the planet and the stars in the PH1 system. Here below are the properties that come out of the combined photometric-dynamical model that uses the radial velocity observations and Kepler light curve for both PH1 and the stars,. The age we estimate for the entire system from spectral modeling. We estimate the mass of the planet by the fact that it not massive enough to pull on its parents stars sufficiently for us to see slight changes in the timings of when the stars eclipse each other (so when the smaller cooler star crosses the face of the larger hotter star and when the smaller cooler star crosses behind the larger hotter star).

We confirmed with modeling the eclipsing binary properties with just the Kepler light curve, and we’re confident in our estimation for the planet and host star properties. The planet is a gas giant, a bit bigger than Neptune and slightly smaller than Saturn. PH1 orbits its parent stars at a distance between Mercury and Venus in our own Solar System. The planetary system is stable. The planet happily orbits the eclipsing binary every ~138 days not really noticing there’s a second pair of stars out at 1000 AU .
PH1 is the 7th circumbinary planet, and the 6th circumbinary system. Below are the orbits of all the circumbianry Kepler planets and PH1 (not depicting the second distant pair of stars).So why do we care? Well, circumbinary planets are the extremes of planet formation, and we need to understand how they form if we are really understand how we form planets in our own solar system. Planet formation models need to be able to explain both environments, and each of the systems detected gives us another puzzle piece to this picture.

Turning a planet candidate into a bona fide planet
Today we have a guest post by Tom Barclay, Tom is a member of the Kepler team and also a collaborator and co-author on our second Planet Hunters paper. Tom is a research scientist supporting the work of the Kepler mission. He got his Ph.D from University College London in the UK before moving to NASA Ames Research Center in California where he spends time improving the quality of the Kepler data products, finding new planet candidates and supporting the wider astrophysics community.
The Kepler team have found several thousand exoplanet candidates. The number of targets showing transit-like signals is increasing on a nearly daily basis as we search through light curves. However, these candidates are just that, candidates. Even though the planet candidates list is thought to have a high degree of fidelity, meaning that the vast majority of candidates are indeed real planets (somewhere in the region of 90%), it requires significant amounts of time and resources to turn a planet candidate into a planet.
I’ll start by being careful with my terminology. The Kepler team use two terms when deciding a candidate is a planet. Confirmation and validation. The former generally only used when we have spectroscopic radial velocity follow-up observations. These are measurements of the wobble induced on the star by the mass of the planet. The planet and star orbit a common point in space. When the planet is moving towards us the star moves away, and vice versa. When the star moves away it gets a little redder and when it moves towards us it get a little bluer. We measure these shifts and it tells us how fast the star is moving in along out line of sight.
Radial velocity measurements in combination with a transit give the planet’s mass and radius. A radial velocity detection of a planetary mass object (normally taken to be less than 13 Jupiter masses) is very unlikely to be erroneous and we are therefore happy to confirm the existence of a planet.
In order to measure a radial velocity a planet must be close enough and massive enough to have a measurable effect on the star. The best instruments currently available are sensitive to a periodic change in radial velocity of around 1 m/s and even getting this precision requires a bright star. The Earth causes a radial velocity pull on the Sun of around 10 cm/s, measuring with this precision is out of the question with currently available instruments. We therefore require another method to use another method if we want to turn small planet candidates into planet.
Validation of a planet
Validation of a planet applies when we use a statistical argument to say that it is much more likely that the transit signal is caused by a planet passing in front of the the target star (I’ll call it star A) that it is to be caused by something else.
There are 4 main ‘something else’, or false positive, scenarios we consider.
- A background eclipsing binary
- A background planetary system*
- An eclipsing binary physically associated with the star A
- A transiting star-planet system physically associated with star A (***There is some debate on whether a planet orbiting a star other than star A should really be considered a false positive. It is still a planet but it does contaminates our statistics on how many small planet are in the Galaxy.**)
A background eclipsing binary is a system of two stars that are appear fainter than star A, usually because they are far away (although they could be intrinsically faint stars which are, counter-intuitively, in the foreground between us and star A). The two fainter stars pass in front of one another much like a transiting planet does and cause a periodic dip in brightness. Because star A is much brighter than the eclipsing system, the eclipse depth appears to be much shallower than it really is and hence the eclipse looks similar to planet transiting star A.
A background planetary system is much the same as scenario (1) but the fainter system contains a star and a planet instead of two stars. If we think the transit is of a planet around the larger star A, we get the planet radius wrong. If we are not careful this scenario could cause us to claim a Jupiter-sized planet is Earth-sized.
Scenario (3) is what is known as a hierarchical triple. There are three stars in the system, star A and two lower mass stars which eclipse each other and orbit around the same center of mass as star A. This is more common than one would initially think guess. Around half of all stars are members of binary systems and in the region of 10% of these are triple or multiple star systems. The light from star A washes out the eclipse of the smaller stars and the eclipse looks much more shallow than it intrinsically is.
Finally, there is the case where a star-planet system orbits star A. The depth of the transit is decreased by the presence of extra light from star A and we get the planet radius wrong.
We try to obtain high resolution images using fancy techniques like adaptive optics imaging which changes the shape of one of the telescope’s mirrors to correct for the movement of the air in the atmosphere. These images allow us to see very close to the star and therefore look for other stars nearby in the image that could cause the transit-like signal. Typically if we don’t see star nearby star A we are able to say there are no stars further than 0.1 arcseconds away (0.00003 degrees) which could cause the transit-like signal. We are then able to make use of models of our Galaxy to predict the probability that there is a star in the right brightness range and within the allowed separation from star A that could mimic the transit signal. It is common for us to be able to say there is less than one in a million chance of a there being an allowed background star. When we take into account the probability that a background star is an eclipsing binary or hosts a planet the result is usually that it is very unlikely that there is a background eclipsing binary or star-planet system.
Ruling out a physically associated star-planet or eclipsing binary system can be much more challenging. We can again use the high resolution imaging but it is much more likely that a companion star is very close to star A than is the case for a background star. One thing on our side is that the shape of the transit can be used to rule out a stellar eclipse: eclipses are usually much more ‘V-shaped’ than the typically ‘U-shaped’ planet transit. We can often say that we cannot fit the shape we observe with a stellar binary. It is also possible to rule out planet transits around a smaller star because the timescale of the ingress and egress (the part of a transit where the planet is moving into and out of transit) does not agree with the transit depth as both these piece of information yield the planet radius. However, we really need good signal-to-noise in order to place firm constraints on the ingress and egress durations. Even so, it always gives us some information even if it is not particularly constraining and this can be used to calculate a false positive probability.
The final step is to sum up the combined false positive probabilities from the different scenarios and compare that to the probability that the transit signal is due to a planet transit around star A. If the transit scenario is much more likely (say 1000 times more likely) than a false positive we claim the planet is validated. On other occasions we have to hold our hands up and say we can’t rule out the false positive scenario with a high enough degree of confidence and the source of the signal remains a planet candidate.
The case where stars host multiple planet candidates, such as that found by the Planet Hunter in the paper by Chris Lintott, is a particularly interesting one. This is because the probability that the a multi-planet candidate system contains a false positive is much lower than for single planet candidates system, somewhere in the region of 50 times less likely. This makes validation much easier.
Planet Hunters have already shown they can find these multi-planet system. Keep searching a more will appear, especially long period ones. There is a good chance that there is an Earth-like planet hiding somewhere in the data currently available.
Closer to Home
As I write this blog post, the transit of Venus is ongoing, with Venus finishing its slow march across the face of the Sun in less than an hour. The next time this will event will come around will be well after out life times in December 2117. The internet has been abuzz with these breathtaking images of the transit from all over the world from space telescopes,ground-based telescopes, even iphones strapped to solar eclipse glasses(!). I wanted to share my impressions of the event and how that ties into what we do at Planet Hunters .
For me personally, I wasn’t expecting to see the transit of Venus from New Haven. Yale’s Leitner Family Observatory was planning events, but it was cloudy starting in the morning, and it was predicted to be that way all day. I still packed the eclipse glasses, that I had gotten from the conference in Japan that I was at a few weeks back (the conference ended the day before the annular solar eclipse), in my bag before heading out this morning. I was hoping but not holding my breath for there to be a clearing of the clouds later in the afternoon, but it had rained midday. The clouds were thinning a bit in the afternoon, teasing with some small glimpses of the Sun or a brief moment where the sunlight could be seen trying to peak through. I remember on one of my first observing runs, when the weather was bad talking to the lead observer, the older graduate student in my research group. I remember her telling me about sucker holes in clouds, holes in the otherwise thick cloud cover. They happen, but not go to chasing them with your telescope because the can close and move just as fast as they appeared. I was hoping maybe we’d get a clearing in the clouds but it didn’t look like it was going to.
I was already resided to the fact I was going to be watching online on the live streams. I had even lamented to Chris who’s in Norway, in the land of the midnight Sun, for the transit who also had clouds from horizon to horizon for the start of the event. I got on the bus to go home, and noticed what I thought was sunlight on the buildings. I got off a few stops later so I could walk the rest of the way home (or to the observatory just in case), and low and behold – a sucker hole had opened and there was the Sun struggling but nearly all the way out of the clouds staring back at me right above the astronomy building. I pulled out those eclipse glasses and my own eye glasses (that I rarely wear) and there it was. A bit of cloud still coming over in waves across the Sun’s disk, but there was a black spec on the top right. That was Venus! I made it to the Leitner Observatory where the other postdocs and grad students were, sharing our eclipse glasses to the members of the public who had come to the event and were in line to see through the solar telescopes. We also also got a chance to see the transit through solar telescopes. I captured a neat image from a solar spotter that an amateur astronomer (and also a fellow Planet Hunter) had kindly brought along. As the sun set, the clouds came back as quickly as they had parted and the sky was covered and grey again.

View of Venus and the clouds on the Sun’s disk from a sun spotter in New Haven
I have to say it was truly breathtaking and I hope you got to see it yourself and if you didn’t see it outside that you were able to view the transit online. It is amazing to think that that small dark sphere is really a planet moving in front of our Sun.
One of things for me that is so fascinating is how our view of exoplanets has changed since the last transit of Venus, which occurred in 2004. Kepler hadn’t launched, we didn’t have over 2000 transiting planet candidates (or Planet Hunters 🙂 ) Kepler really has changed how we view the universe around us, with extreme worlds orbiting two stars as well as the first detection of Earth-sized planets, and the first set of planets orbiting in the habitable zone of their stars (meaning if they were rocky or had rocky moons they might be able to have liquid water pool on their surfaces).
The same way that Venus is blocking out part of the Sun’s light (about 0.1%), is the way we identify planets in the Kepler light curves with Planet Hunters. If aliens in another solar system could watch the Sun today/yesterday, they would see a drop in light of about 0.01% for nearly 7 hours indicating Venus’s presence. We see the drops in the light curves indicative of a planet orbiting their parent stars in the Kepler field. We’ve already found four new planet candidates that weren’t previously identified by the Kepler team but there’s something different in seeing the light curve compared to seeing the Venus transit live. I’ve always known these planet candidates we’re finding are marching across the disks of their parent stars, but seeing the transit of Venus it felt real. I’m heading back to spend the rest of the night working on my next Planet Hunters paper, thinking about the transits and planetary systems we’re finding and it feels just a bit more familiar…..a little bit closer to home….
~Meg
PS. Fancy looking for some more transiting planets, come to the Planet Hunters website and give it a try.
The Transit of Venus and the Scale of the Universe
I’ll start by introducing myself as I’m not involved in Planethunters, but Meg asked me if I could write an article for you here about the Transit of Venus after I mentioned on Twitter that I was enjoying researching the topic for a talk I’m giving. I’m a Research Fellow at the Institute of Cosmology and Gravitation at the University of Portsmouth/SEPNet (South East Physics Network), and I’m funded by The Leverhulme Trust as an Early Career Fellow to work on Galaxy Zoo science. I’ve been part of the Galaxy Zoo science team since 2008 and I lead the studies of the interesting class of red spirals which were found by Galaxy Zoo, and am also interested in the role bars seem to have in slowing down star formation in spiral galaxies. You can read blog posts I’ve done for the Galaxy Zoo blog, which include explanations of these studies at http://blog.galaxyzoo.org/author/karenlmasters/
On 5th/6th June 2012 Venus will pass between the Earth and the Sun. It’s shadow will cross the Sun taking about 6 hours in total, although the length of that which is visible varies significantly depending on where you live on Earth. In the USA the beginning of the transit will be visible as the Sun begins to set on 5th June, while in the UK we’ll see the end of the transit after the Sun rises on 6th June.

The planet Venus orbits the Sun inside the orbit of the Earth, and passes between the Earth and the Sun quite frequently. However the planes of the two orbits aren’t quite aligned, so most of the time Venus passes either above or below the disk of the Sun. Actual transits are rare, but very predictable. They happen in pairs separated by 8 years, and then after each pair follows a period of either 121.5 or 105.5 years without any transits. The 2012 transit is the second of a pair – astronomers around the world viewed the first transit of the modern age in 2004, and the next transit won’t happen until December 2117.
To view a transit of Venus does not need to be technically challenging, but in its simplest form involves looking at the Sun – so some safety precautions must be taken. You must never look directly at the Sun! Serious eye damage or even blindness could occur if you did that, so take this warning seriously! My advice for viewing the transit if you are not a keen amateur astronomer, or able to get to a viewing party, is to either get your hands on a pair of Safe Solar Viewers (like these ones from Astronomers Without Borders), or to view the event via a web cam (like this one from Hawaii where the entire transit is visible, or GLORIA which is planning to show feeds from Australia, Japan and Norway). This last method also has the advantage (especially for UK viewers) of not being affected by local cloud cover, and has exactly zero risk of eye damage! If you come to one of my talks I hope to have solar viewers to hand out.
So why should you care about a black dot crossing the Sun, or perhaps more pertinently, why do I, and an astronomer who studies galaxies, and works in a cosmology department care enough to write a blog post about it and give several talks? Well historically transits of Venus have been very important in helping astronomers understand the scale of the solar system, and from that the scale of the Universe. Basically when Venus crosses the Sun we know that it, the Sun and the Earth are all in a straight line. Very slight differences in the viewing angle from two observers on the Earth can then be used along with our basic knowledge of trigometry to measure the distance to the Sun. For over 100 years, the distance to the Sun measured this way was the most accurate measurement we had.
![]()
From knowing the distance to the Sun, we can use slight changes in the apparent position of nearby stars as the Earth orbits the Sun to get their distances (more triangles – this is called the parallax method), and from those stars we calibrate methods which use stars of known or estimated brightness to estimate distances to nearby galaxies, and we jump from distances to nearby galaxies to more distant galaxies and eventually the whole universe. The distances to faraway galaxies have taught us that the universe is expanding and started in a Big Bang around 15 billion years ago, and even if we go to the observations that suggest the universe contains a mysterious “Dark energy” (which won the 2011 Nobel Prize in Physics), they are ultimately based on us knowing the distance to the Sun. So that’s why I think it’s important.
Here in Portsmouth we’re running a workshop about the transit of Venus on HMS Warrior, in the Portsmouth Historic Dockyard. We plan to demonstrate the triangulation method by using it to estimate the distance from the Warrior to the local landmark “The Spinnaker Tower”. Two people will stand on the desk and we’ll mark out from them the direction to the Spinnaker Tower. Making one of the angles a right angle, we can then estimate the distance to Spinnaker (which is about 300m) by d = b/cos A, where A is the other angle, and b is the distance between the two people on deck.

Google Map image of Portsmouth including HMS Warrior (top) and The Spinnaker Tower (bottom).
This isn’t exactly the method used in the historical measurements, but it demonstrates the idea. Of course when observing the transit of Venus from two widely separated places on Earth, it’s not exactly easy to measure the angle between the sight lines. What Edmund Halley figured out in 1678 was that if you could measure the times when Venus stars and ends its transit you can get at the same information.
In all of recorded history, we have records of a total of six transits of Venus that have been observed (1639, 1761, 1769, 1874, 1882 and 2004). You have to feel sorry for Johannes Kepler, who predicted the transit which occured in 1631, but then died in 1630. No-one is recorded to have used his prediction that year. Jerimiah Horrocks and Willam Crabtree (two British astronomers who were friends) have the honour of being the first humans known to have seen Venus transit. Horrocks found and improved Kepler’s earlier predictions, and both men successfully observed the 1639 transit from Northern England (in December!).

Scientific observation of the transit started in the 18th century following Halley’s suggestion to use it to measure the distance to the Sun. There is a hugely rich and entertaining history of these expeditions to view the transit, and several books have been published. I’m just going to tell you a couple of the stories which struck my interest! A lot more, and links to some of the books can be found via the Wikipedia page on Venus Transits, TransitofVenus.org, and TransitofVenus.nl.
For the 1761 transit, two famous explorers got involved. Mason and Dixon (still in Britain, and before they set off to map the USA) were commissioned by the Royal Society to observe the transit from Sumatra. They met in Portsmouth, and set sail from here on HMS Seahorse (which a decade later would have a famous midshipman named Horation Nelson). Enroute to Sumatra they got attacked by the French (the French and English being at war then), and decided to give up. They wrote the Royal Society of their intentions and were promptly told they better get right back on the ship to observe the transit or else. They did, and eventually ended up viewing if from South Africa.
The 1769 transit also had some famous viewers. Captain Cook was ordered to set sail in HMS Endeavour, partially to observe the transit from Tahiti, but then to continue on and look for the mythical “Australia”. On that trip they didn’t find Australia, but they did land and claim New Zealand. And in Tahiti, they set up a “Fort Venus” from which to stay safe from the natives and view the transit. This voyage is being repeated this year in a replica vessel, and you can follow along at the HMB Endeavour Website.
These 18th century observations results in a measurement of the distance to the Sun of 153+/-1 million kilometers, which was a huge improvement over previous estimates, but not as good as they expected. The timings were thwarted by something which came known as the “black drop effect” where the shadow of Venus seems to bleed into the edge of the Sun. This meant that the start time of the transit could not be measured to better than a few seconds.
![]() The black drop effect, photographed in 2004.
The black drop effect, photographed in 2004.
In 1874 several more expeditions set out, including several on Royal Navy Ships, such as HMS Volage, one of the largest mixed sail and steam ships ever built, which ferries the British expedition to the Kerguelen Island in the Southern Indian Ocean. Such measurements helped improve the distance measurement to 149.59+/-0.3 million kilometers. By 1881 it had been decided the distance to the Sun could be estimated better by other methods, although several expeditions still set out, and the first photographs of the transit were taken.
A photograph of the 1882 transit, taken by a US expedition.
The current best distance to the Sun is 149.5978707 million kilometers, +/- 3 metres, measured using radar ranging to the inner planets. It’s known so accurately that we can measure it’s changing, growing about 15 metres every century.
The first transit of Venus to happen in the modern age was in 2004. You can find videos of this event (like the one below), which I was lucky to view from a small observatory near Ithaca, NY while I was studying for my PhD in Astronomy at Cornell University.
For the 2012 transit, apart from encouraging people to view the event as a last in your life time chance, there are couple of new developments. First smart phone technology which didn’t even exist in 2004 has allowed the development of a “Transit of Venus Ap“. In this Ap you can input the time you view the transit starting and/or ending, and participate in a global experiment to measure the distance to the Sun. Download the Ap in advance to practice inputing your measurement.
Interest in exoplanets has also significantly grown, including the signature that the atmospheres of those planets might have in the observed spectrum of a star when the planet is transiting. The Hubble Space Telescope will try to simulate this type of observation during the transit of Venus, observing the light from the Sun reflected by the Moon (if HST looked at the Sun it would be destroyed) to search for the signature of the atmosphere of Venus. You can read more about the plans on the NASA website.
Anyway I encourage you to get out there, or get online and view the last transit in our lifetime. Use the resources attransitofvenus.org, to work out the timings of the transit from your location, or search for local events. Other useful resources are the Royal Astronomical Society page on the Transit of Venus, in the UK, the HM Nautical Almanac Office. Also of possible interest, the Royal Observatory, Greenwich has a Venus Transit page, and a special (free) exhibit running until September 2012. And of course there’s a special Planethunters page on the transit too.
